Site management
Construction progress tracking: measure % complete, compare it with the plan and forecast the finish
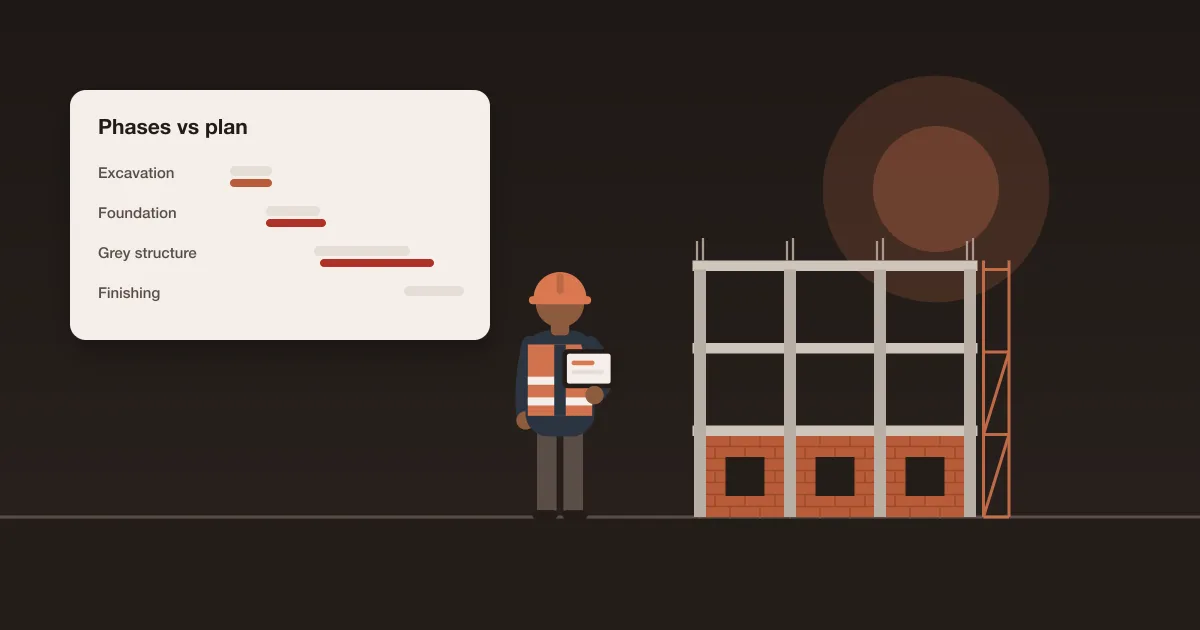
“About 60% done” is not a progress report. Four numbers are: how much is built, how much the plan says should be built by today, how many days behind that puts you, and when the job will really finish. Here is how to work out each one, on paper or in software.
On this page · 11 sections
- What construction progress tracking measures
- Three ways to measure how far a phase has got
- Weight each phase by what it is worth
- Compare it with the plan: % planned by today
- Turn the gap into days behind
- Forecast the finish date from the recent pace
- Worked example: an office building on day 125
- Check progress against money spent
- A weekly progress routine
- Questions people ask
- Sources
Key takeaways
- Measure each phase the same way every week: by quantity done where you can, by agreed steps where you can't, and by judgement only as a last resort.
- Weight phases by their budget. A simple average lets a finished boundary wall look as big as an unpoured slab.
- Compare % built with % planned by today from the baseline dates, then read the gap in days: find the day the plan was where you are now.
- Forecast the finish from the recent pace (progress gained in the last 30 days), not from the original programme.
- Money spent is not progress. Put % spent next to % built: if spend runs ahead, the job is costing more per unit of work than planned.
What construction progress tracking measures
Construction progress tracking is the routine of measuring how much of a building job is done and comparing it with the plan, so you know early whether it will finish on time. It needs a plan with dates (a baseline), a consistent way to measure each phase, and an update at a fixed interval, usually weekly. Everything else is arithmetic.
| Number | Question it answers | How it is worked out |
|---|---|---|
| % built (% complete) | How much of the job is done? | Each phase's progress, weighted by its share of the budget |
| % planned by today | How much should be done by now? | The share of each phase's planned duration already passed, weighted the same way |
| Days behind | How late is the job today? | Today minus the day the plan reached today's % built |
| Forecast finish | When will it really finish? | Today + work left ÷ recent pace |
Earned value management uses the same idea under other names: the budgeted value of the work done (earned value) against the budgeted value of the work planned by today (planned value). Designing Buildings Wiki describes it as comparing the work planned to have been done by a stage with what has actually been done and what it cost. This guide keeps the names a site team would use.
Three ways to measure how far a phase has got
| Method | Example | Use it for | Watch out for |
|---|---|---|---|
| Quantity done | Blockwork: 420 of 700 m² laid = 60% | Repetitive work you can count: blockwork, plaster, tiling, piling | Quantities must come from the drawings or bill of quantities, not from what was delivered |
| Agreed steps | Roof slab: shuttering 30%, steel fixed 30%, poured 30%, cured and struck 10%. Shuttering and steel done = 60% | Work that happens in stages: slabs, columns, roofs, services first fix | Agree the step weights before work starts, not when reporting |
| Supervisor's judgement | “Finishing on the ground floor is about a third done” | Small or mixed work where counting costs more than it tells you | Optimism. Never report 100% until the phase is actually finished |
Pick one method per phase and keep it for the whole job. Switching methods mid-phase makes the progress line jump without any work being done.
Weight each phase by what it is worth
To get one % complete for the whole job, weight each phase by its budget (or its estimate if it has no budget yet), then add them up. A simple average of percentages treats every phase as the same size, and the result can be badly wrong.
| Phase | Budget | Progress | Value of work done |
|---|---|---|---|
| Boundary wall | $6,000 | 100% | $6,000 |
| Roof slab | $54,000 | 20% | $10,800 |
| Both | $60,000 | Simple average 60% · weighted 28% | $16,800 of $60,000 |
The simple average says the job is 60% done. Weighted by value it is 28%: $16,800 of $60,000. The weighted figure is the one the client's payments, the remaining budget and the finish date depend on.
Compare it with the plan: % planned by today
% planned by today comes from the baseline: the phase dates as first agreed. Keep them, even after dates change, or you'll be comparing progress with a plan that moves to meet it.
- 1For each phase, work out the share of its planned duration that has passed by today: 0% before it starts, 100% after it should have finished, and days passed ÷ planned days in between.
- 2Multiply that share by the phase's budget.
- 3Add the results and divide by the total budget.
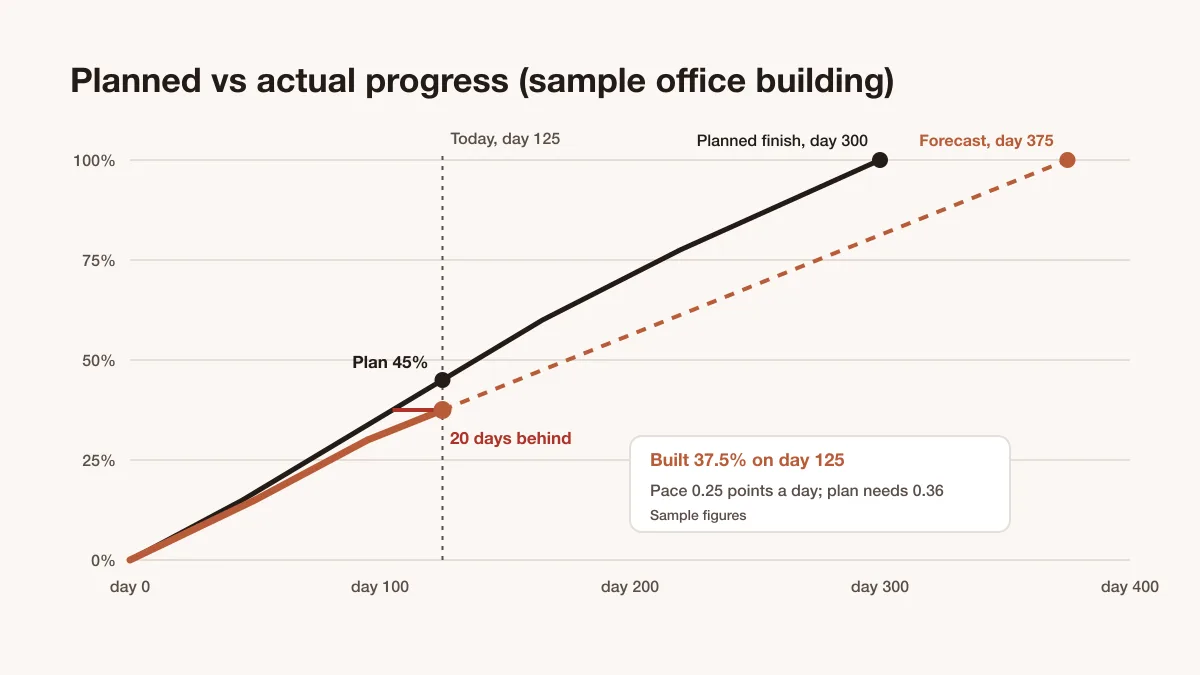
Plot the planned % for every day of the job and you get the familiar S-curve: slow at the start, steep through the structure, flattening through finishes. Plot actual progress on the same chart and the gap between the lines is the whole story.
Turn the gap into days behind
“7.5 points behind” means little to an owner or a client. Days do. Find the day on the planned curve when the plan reached the % you have actually built. Today minus that day is how far behind the job is.
The schedule performance index (SPI) says the same thing as a ratio: earned value ÷ planned value, or % built ÷ % planned by today. Below 1 the job is behind schedule, above 1 it is ahead (Designing Buildings Wiki: SPI; the formula is also given as BCWP ÷ BCWS by AcqNotes).
Forecast the finish date from the recent pace
The original programme says when the job should finish. The recent pace says when it will. Take the progress gained over the last 30 days, divide by 30 to get points per day, then divide the progress still to do by that pace.
Forecast finish = today + (100 − % built) ÷ (points gained in the last 30 days ÷ 30)
- Wait for at least a week of recorded work before trusting a pace. Until then, use the plan's finish date.
- Use a 30-day window, not one week. A week of rain or a late delivery would swing a one-week pace wildly.
- Compare the recent pace with the pace the plan needs from today. If the plan needs 0.36 points a day and the site is doing 0.25, the date will keep slipping until something changes on site.
- A forecast that moves later every week is a trend. Look for its cause in what usually delays construction.
Worked example: an office building on day 125
A two-storey office building with a budget of $400,000 and a planned finish on day 300. Today is day 125. All figures are sample figures.
| Phase | Budget | Planned days | Planned by day 125 | Built | Value built |
|---|---|---|---|---|---|
| Substructure | $60,000 | 1–45 | 100% | 100% | $60,000 |
| Ground floor frame | $90,000 | 46–105 | 100% | 90% | $81,000 |
| First floor frame and roof | $90,000 | 106–165 | 33% | 10% | $9,000 |
| Walls and envelope | $70,000 | 166–220 | 0% | 0% | $0 |
| Services and finishes | $90,000 | 221–300 | 0% | 0% | $0 |
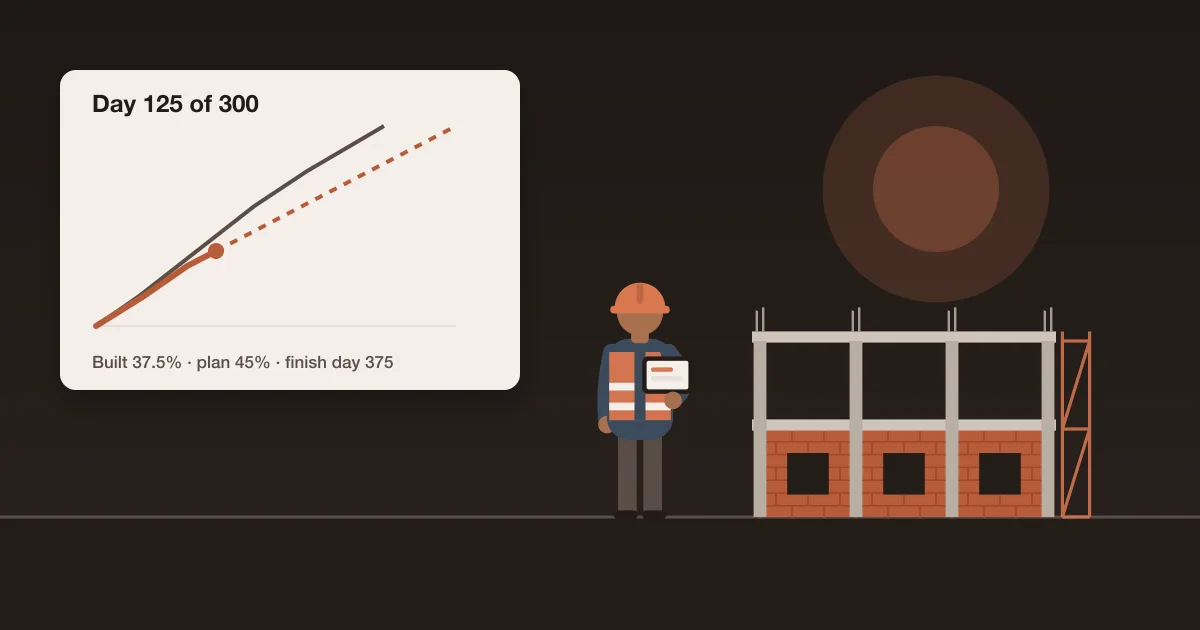
| Whole building | $400,000 | 1–300 | 45% | 37.5% | $150,000 |
- 1Planned by today: $60,000 + $90,000 + one third of $90,000 (20 of 60 days) = $180,000, or 45% of $400,000.
- 2Built: $60,000 + 90% of $90,000 + 10% of $90,000 = $150,000, or 37.5%.
That is 7.5 points behind, and an SPI of 150,000 ÷ 180,000 = 0.83. - 3Days behind: the plan reached $150,000 at the end of the ground floor frame, on day 105. Today is day 125, so the job is 20 days behind.
- 4Pace: on day 95 the building was 30% built ($120,000).
It has gained 7.5 points in 30 days, 0.25 points a day. - 5Forecast finish: 62.5 points left ÷ 0.25 = 250 days, so day 375.
That is 75 days after the planned day 300. - 6Pace needed to finish on time: 62.5 points in the 175 days left = 0.36 points a day, about 43% faster than the last 30 days.
Notice that the job is 20 days behind today but heading for 75 days late. Being behind is about the past. The forecast is about the pace, and the pace is what has to change.
Check progress against money spent
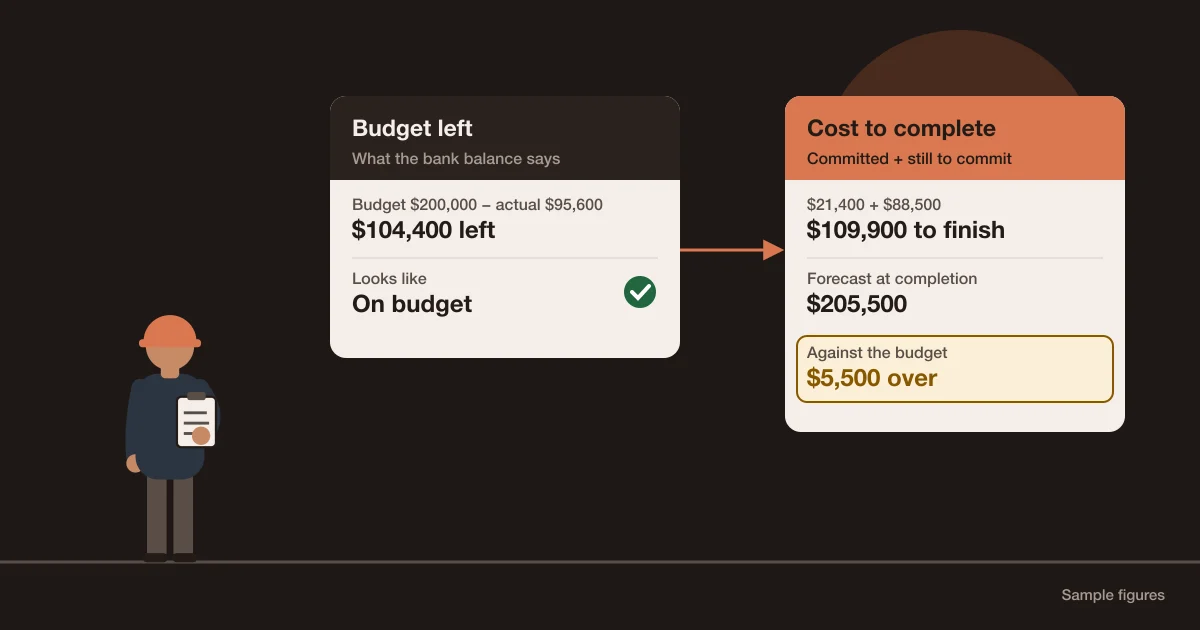
Put % spent next to % built. In the example, $170,000 has been spent on $150,000 of work: 42.5% of the budget for 37.5% of the building. Money is running 5 points ahead of the work, so the job is late and costing more per unit of work than planned (a cost performance index of 150,000 ÷ 170,000 = 0.88).
Track the money side phase by phase with construction budget vs actual, and work out what the rest will cost with cost to complete. Progress tells you how much is left to build; those two tell you what it will cost.
A weekly progress routine
- 1Same day each week, the site engineer records progress on every running phase, using that phase's method.
- 2Work out % built and % planned by today from the baseline.
- 3Convert the gap to days behind and update the forecast finish from the last 30 days.
- 4Put % spent next to % built for each phase.
- 5For any phase more than a week behind, write one line: the cause and what changes next week.
- 6Send the owner (and, if you share it, the client) the four numbers, with this week's photos.
In construction management software steps 2 to 4 happen on their own as the site records progress, so the routine shrinks to recording, reading and acting. On several sites at once, run the routine for each and list them latest first. Managing multiple construction sites covers the rest of the owner's weekly review.
Before you send a progress report
0 of 8 in placeTick what is already in place on your site.
Questions people ask
How do you calculate percent complete on a construction project?
Measure each phase (by quantity done, agreed steps or judgement), multiply each phase's % by its budget, add the results and divide by the total budget. That gives % complete weighted by value, which a simple average of percentages doesn't.
How do you know if a construction project is behind schedule?
Compare % built with % planned by today from the baseline dates. If % built is lower, the job is behind. To say by how much, find the day the plan reached your current % built and count the days since.
How do you forecast a construction project's completion date?
Take the progress gained in the last 30 days, divide by 30 for points per day, and divide the progress still to do by that pace. Add the result to today's date.
Is % complete the same as % of budget spent?
No. % spent is money; % complete is work. When spending runs ahead of progress, the job is costing more per unit of work than planned.
How often should construction progress be updated?
Weekly, on the same day, is enough for most jobs. Fast or troubled jobs need it more often. Regular dates matter more than frequency, because the forecast depends on the pace between updates.